Cliche templates with dull visuals and charts belong to the stone age. Stats reveal that 37% of customers turn to social media channels for making purchasing decisions. Today, with a whopping 2.7 billion active users, Facebook remains one of the most popular social media channels globally. With that comes Facebook reporting into the picture!
Analyzing and tracking social media business activities on Facebook becomes essential as it is the first choice of users for people worldwide. Constructing Facebook reports is imperative to showcase the ROI of your digital marketing campaigns to your investors.
A well-structured Facebook report garners the opportunity for you to discover promotional insights. What’s a better medium than PowerPoint presentations to showcase your Facebook reports to your clients.
Slide decks prove ideal for delivering these reports owing to their visual appeal. SlideModel offers a plethora of specialized eye-catching templates perfect for Facebook reporting. This article will enlighten you on how to create the best Facebook reports and further understand how to reach a wide audience, align both- B2C and B2B goals while keeping the existing audience engaged.
Why is Facebook Reporting Important?
Facebook Reports form an essential part of your digital marketing strategy since it allows you to pick goals that bring you growth, further measure your marketing baseline to check how it is performing over time. They help you to present the analytical data in a visually appealing manner. Your ultimate goal with creating them is to make the data easily digestible for your audience.
More often than not, long and tedious reports presented by professionals send the audience into a slumber. Hefty paragraphs with data crunched in plain bullets do not work their charm and leave your clients with more questions. Hence, it poses essential to leverage unique PowerPoint templates that display your analysis comprehensively.
Here is why every organization must create beautiful Facebook reports for social media success:
- Assess the ROI of a Facebook campaign
- Highlights the growth or decline of search
- Identifies the strengths and shortcomings of posts
- Features the most valued product by customers
- Tracks brand awareness over time
- Identifies high engagement content
- Tracks organic vs. inorganic campaign success
Utilizing tailor-made templates like Social Media Reports enables you to record, measure, and hone your socially-driven efforts & boost your presentation manifolds. Save your investors the hassle of sitting in hour-long reports. Instead, design compelling slide decks with all the figures and statistics to wow your stakeholders.
Facebook reports offer real insights into behaviors, page views, and interactions as it contains its set of practices, rules, and metrics. It will help you to track your KPIs and analyze metrics for boosting brand reach and perform better. When done right, forming Facebook reports act as a boon for refining your Facebook digital marketing strategy.
5 Steps of Creating Interesting Facebook Reports
Leverage Top-Notch Templates
Facebook reports constructed with stellar PPT templates will not only make them attractive but understandable as well. Today’s digital marketing era demands reports to be crisp and compact with a stunning graphical appeal.
Choose avant-garde templates like Social Media Analysis Reports to present your Facebook insights in an engaging manner. These customizable templates save your time from creating the Facebook report from scratch and instill a professional look to them. Present your report’s KPIs, post engagement, demographics, and return on investment (ROI) with ease.

Integrate Charming Visuals
All text and no visuals will render your Facebook report bland. Powerful and attractive visuals prove to be the best companion for it to reflect its content. Relatable visuals help to reinforce the message of your report rather than decorate. Ensure to use HD and vector graphics to create the maximum impact.
For example, if your Facebook report concerns demographic campaign success, it can include visuals of that respective area. Also, always remember to use high-resolution and non-blurred images as nobody likes to squint their eyes for deconstructing an image. Images and graphics will make your Facebook report lively and aesthetically pleasing.
Color Scheme is the Key (Differences)
The color scheme in a report becomes a significant tool for letting your clients decipher key points and skim information. Color used appropriately can make them know about your best and worst performance. Employ a color-coding scheme to show the differences among various elements. For example, assign red for losses and blue for success.
A golden tip here is to avoid a color overload. You don’t want your report to resemble a coloring book. Keep the color scheme subtle and use them consistently. Keep in mind the color contrast. Always place light text on a dark background and vice versa. The goal of your color scheme must be to highlight the chief points in your report rather than distract.
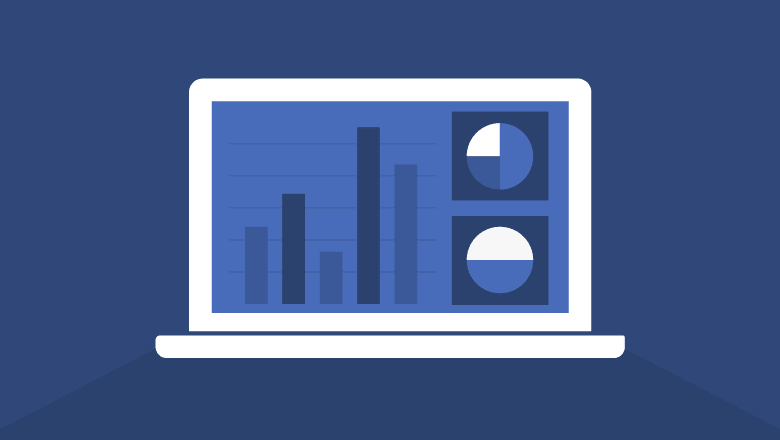
Data Visualization
Add some vigor to your Facebook reports with impressive data visualizations. Employ charts, timelines, flowcharts, diagrams, shapes, and tables to display your data elegantly. You can employ parallel coordinates, heat maps, 3D charts, trend lines, and infographics for your pricing strategy models.
Remember to keep your data visuals uncluttered and clean. A tip here is to make them large enough for everybody to read what’s written inside the visual. Label them properly and make them as captivating as possible. You can even color-code specific portions in your charts to highlight them.
Incorporate Return on Investment (ROI)
Social media ROI reports are based on key performance indicators (KPIs) including Conversion Rate (CR), Click-Through Rate (CTR), Cost per Click (CPC) and several others. It determines the success of your money invested in the social media campaign. Any Facebook report is incomplete without ROI figures. Ensure to track your ROI with appropriate metrics to help your clients see whether your brand performed well or not. Present it with powerful data visuals.
It’s no hidden secret that social media carries a huge potential for brands to build their standing in the 21st century. Facebook is one such platform that has emerged as one of the greatest mediums for digital marketing. Thus, it becomes critical for brands to reach their audience on it and track their performance.
A neat report crafted by following the above steps can help you create beautiful performance-based reports to present to your audience. Embrace the power of Facebook reporting and reap endless benefits for your social media strategy.